# encoding: utf-8
"""
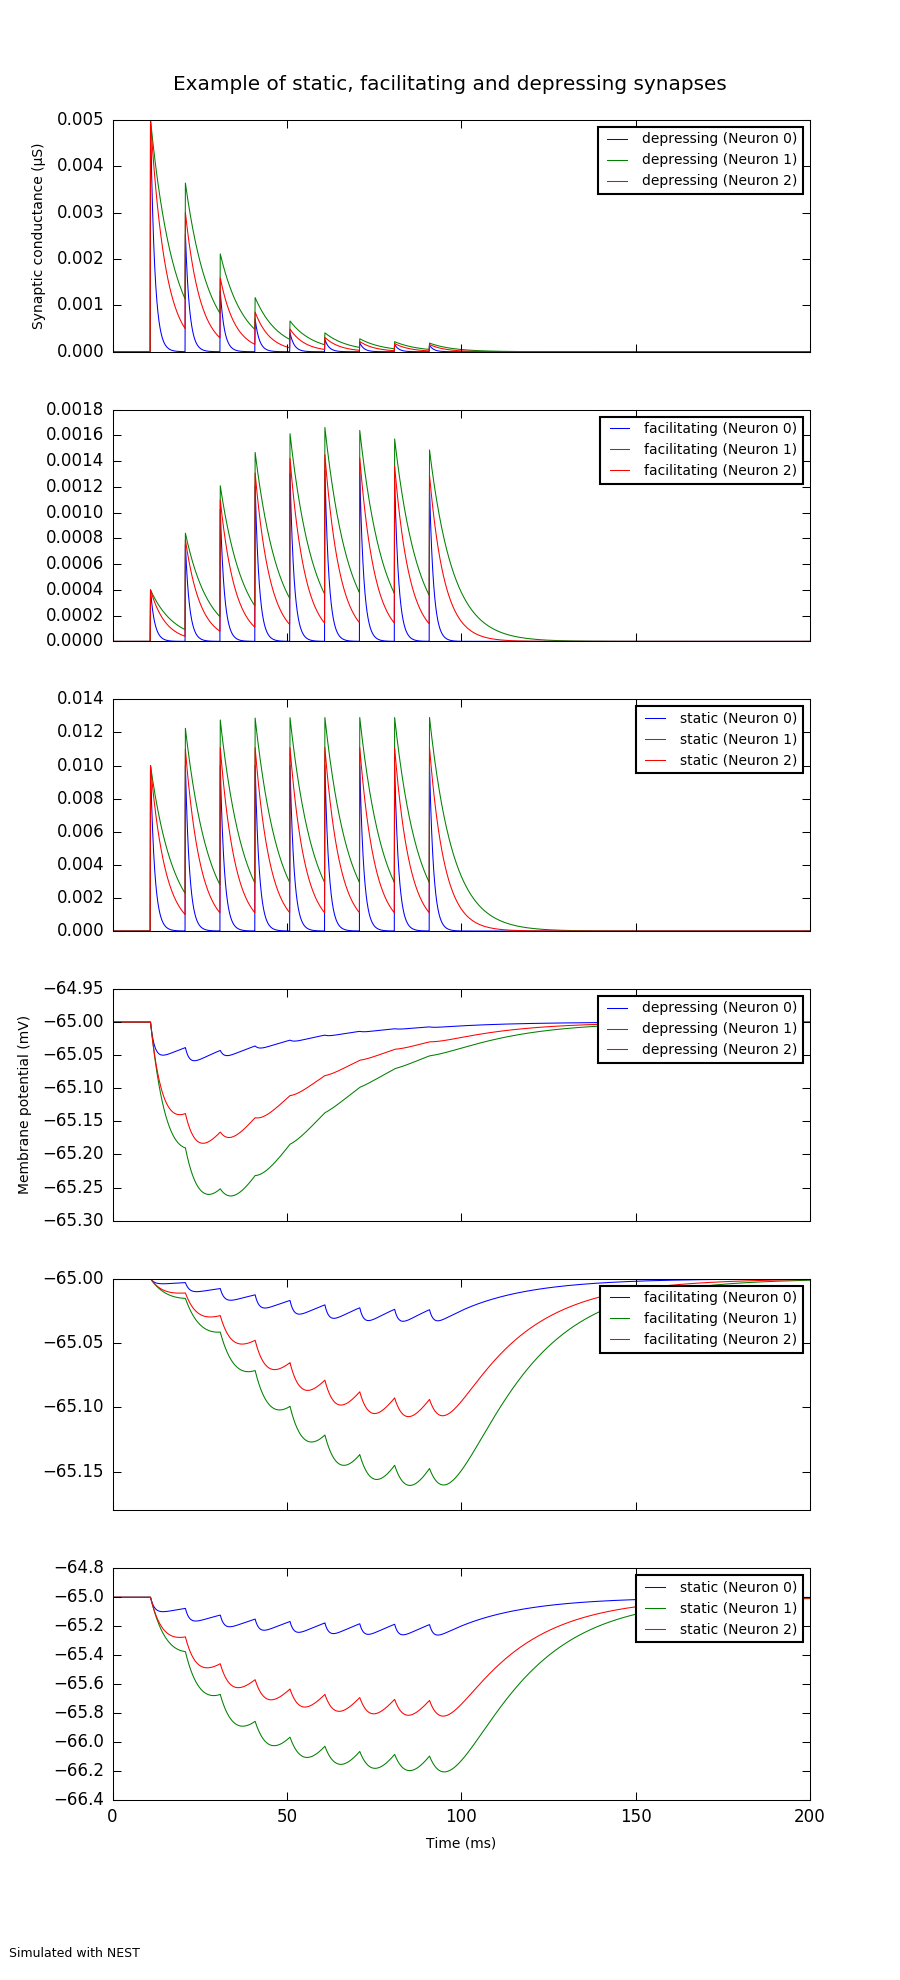
Example of depressing and facilitating synapses
Usage: tsodyksmarkram.py [-h] [--plot-figure] [--debug DEBUG] simulator
positional arguments:
simulator neuron, nest, brian or another backend simulator
optional arguments:
-h, --help show this help message and exit
--plot-figure Plot the simulation results to a file.
--debug DEBUG Print debugging information
"""
import numpy as np
from pyNN.utility import get_simulator, init_logging, normalized_filename
# === Configure the simulator ================================================
sim, options = get_simulator(("--plot-figure", "Plot the simulation results to a file.", {"action": "store_true"}),
("--debug", "Print debugging information"))
if options.debug:
init_logging(None, debug=True)
sim.setup(quit_on_end=False)
# === Build and instrument the network =======================================
spike_source = sim.Population(1, sim.SpikeSourceArray(spike_times=np.arange(10, 100, 10)))
connector = sim.AllToAllConnector()
synapse_types = {
'static': sim.StaticSynapse(weight=0.01, delay=0.5),
'depressing': sim.TsodyksMarkramSynapse(U=0.5, tau_rec=800.0, tau_facil=0.0,
weight=0.01, delay=0.5),
'facilitating': sim.TsodyksMarkramSynapse(U=0.04, tau_rec=100.0,
tau_facil=1000.0, weight=0.01,
delay=0.5),
}
populations = {}
projections = {}
for label in 'static', 'depressing', 'facilitating':
populations[label] = sim.Population(3, sim.IF_cond_exp(e_rev_I=-75, tau_syn_I=[1.2, 6.7, 4.3]), label=label)
populations[label].record(['v', 'gsyn_inh'])
projections[label] = sim.Projection(spike_source, populations[label], connector,
receptor_type='inhibitory',
synapse_type=synapse_types[label])
spike_source.record('spikes')
# === Run the simulation =====================================================
sim.run(200.0)
# === Save the results, optionally plot a figure =============================
for label, p in populations.items():
filename = normalized_filename("Results", "tsodyksmarkram_%s" % label,
"pkl", options.simulator)
p.write_data(filename, annotations={'script_name': __file__})
if options.plot_figure:
from pyNN.utility.plotting import Figure, Panel
figure_filename = normalized_filename("Results", "tsodyksmarkram",
"png", options.simulator)
panels = []
for variable in ('gsyn_inh', 'v'):
for population in populations.values():
panels.append(
Panel(population.get_data().segments[0].filter(name=variable)[0],
data_labels=[population.label], yticks=True),
)
# add ylabel to top panel in each group
panels[0].options.update(ylabel=u'Synaptic conductance (µS)')
panels[3].options.update(ylabel='Membrane potential (mV)')
# add xticks and xlabel to final panel
panels[-1].options.update(xticks=True, xlabel="Time (ms)")
Figure(*panels,
title="Example of static, facilitating and depressing synapses",
annotations="Simulated with %s" % options.simulator.upper()
).save(figure_filename)
print(figure_filename)
# === Clean up and quit ========================================================
sim.end()