"""
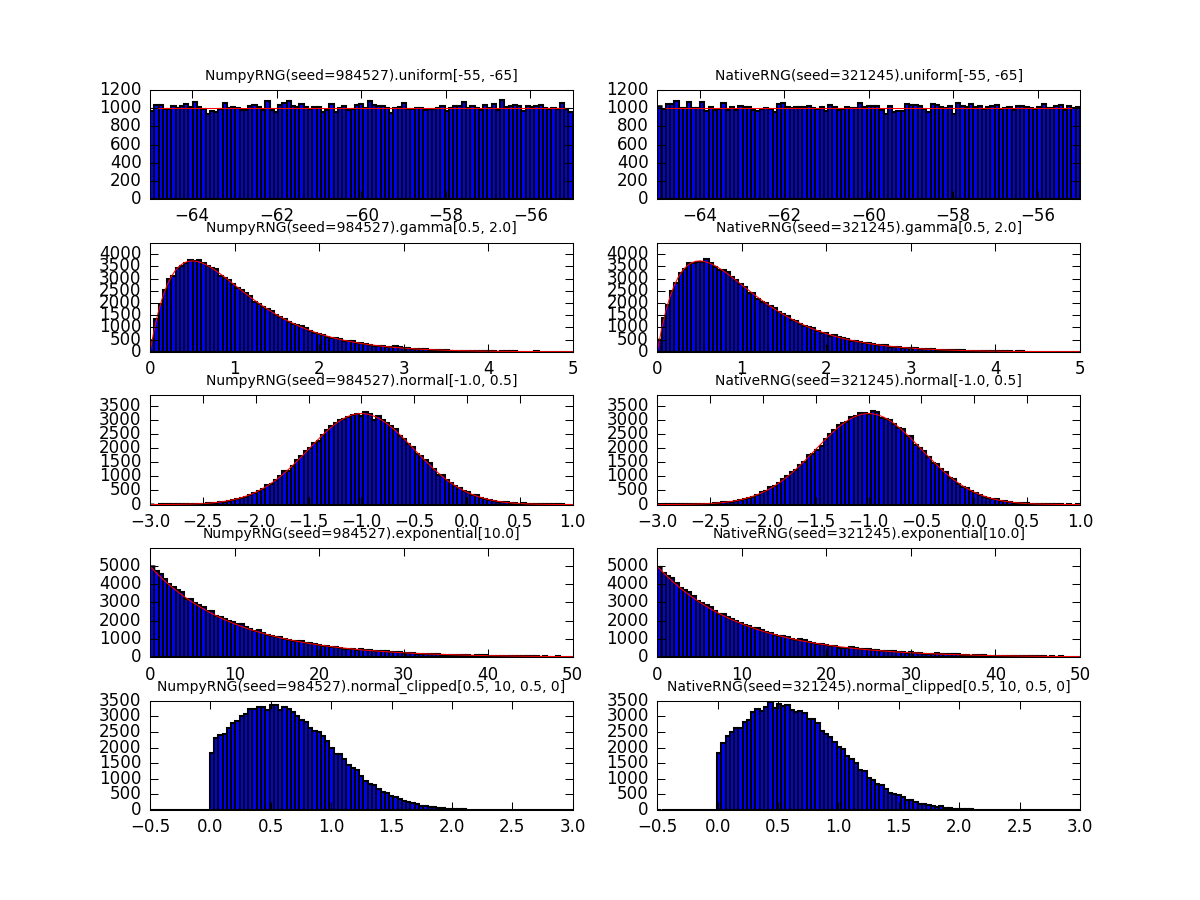
Illustration of the different standard random distributions and different random number generators
"""
import numpy as np
import matplotlib.pyplot as plt
import matplotlib.gridspec as gridspec
import scipy.stats
import pyNN.random as random
try:
from neuron import h
except ImportError:
have_nrn = False
else:
have_nrn = True
from pyNN.neuron.random import NativeRNG
n = 100000
nbins = 100
rnglist = [random.NumpyRNG(seed=984527)]
if random.have_gsl:
rnglist.append(random.GSLRNG(seed=668454))
if have_nrn:
rnglist.append(NativeRNG(seed=321245))
cases = (
("uniform", {"low": -65, "high": -55}, (-65, -55), scipy.stats.uniform(loc=-65, scale=10)),
("gamma", {"k": 2.0, "theta": 0.5}, (0, 5), scipy.stats.gamma(2.0, loc=0.0, scale=0.5)),
("normal", {"mu": -1.0, "sigma": 0.5}, (-3, 1), scipy.stats.norm(loc=-1, scale=0.5)),
("exponential", {'beta': 10.0}, (0, 50), scipy.stats.expon(loc=0, scale=10)),
("normal_clipped", {"mu": 0.5, "sigma": 0.5, "low": 0, "high": 10}, (-0.5, 3.0), None),
)
fig = plt.figure(1)
rows = len(cases)
cols = len(rnglist)
settings = {
'lines.linewidth': 0.5,
'axes.linewidth': 0.5,
'axes.labelsize': 'small',
'axes.titlesize': 'small',
'legend.fontsize': 'small',
'font.size': 8,
'savefig.dpi': 150,
}
plt.rcParams.update(settings)
width, height = (2 * cols, 2 * rows)
fig = plt.figure(1, figsize=(width, height))
gs = gridspec.GridSpec(rows, cols)
gs.update(hspace=0.4)
for i, case in enumerate(cases):
distribution, parameters, xlim, rv = case
bins = np.linspace(*xlim, num=nbins)
for j, rng in enumerate(rnglist):
rd = random.RandomDistribution(distribution, rng=rng, **parameters)
values = rd.next(n)
assert values.size == n
plt.subplot(gs[i, j])
counts, bins, _ = plt.hist(values, bins, range=xlim)
plt.title("%s.%s%s" % (rng, distribution, parameters.values()))
if rv is not None:
pdf = rv.pdf(bins)
scaled_pdf = n * pdf / pdf.sum()
plt.plot(bins, scaled_pdf, 'r-')
plt.ylim(0, 1.2 * scaled_pdf.max())
plt.xlim(xlim)
plt.savefig("Results/random_distributions.png")