"""
Injecting time-varying current into a cell.
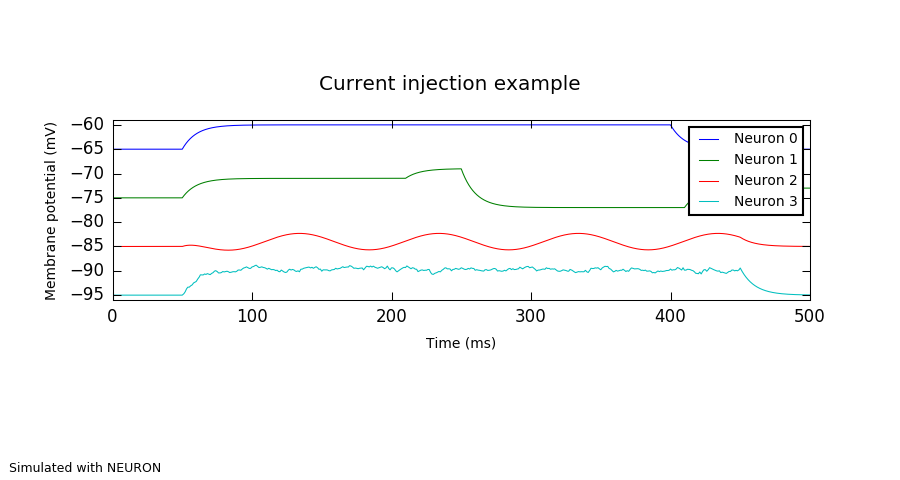
There are four "standard" current sources in PyNN:
- DCSource
- ACSource
- StepCurrentSource
- NoisyCurrentSource
Any other current waveforms can be implemented using StepCurrentSource.
Usage: current_injection.py [-h] [--plot-figure] simulator
positional arguments:
simulator neuron, nest, brian or another backend simulator
optional arguments:
-h, --help show this help message and exit
--plot-figure Plot the simulation results to a file
"""
from pyNN.utility import get_simulator, normalized_filename
# === Configure the simulator ================================================
sim, options = get_simulator(("--plot-figure", "Plot the simulation results to a file",
{"action": "store_true"}))
sim.setup()
# === Create four cells and inject current into each one =====================
cells = sim.Population(4, sim.IF_curr_exp(v_thresh=-55.0, tau_refrac=5.0, tau_m=10.0))
current_sources = [sim.DCSource(amplitude=0.5, start=50.0, stop=400.0),
sim.StepCurrentSource(times=[50.0, 210.0, 250.0, 410.0],
amplitudes=[0.4, 0.6, -0.2, 0.2]),
sim.ACSource(start=50.0, stop=450.0, amplitude=0.2,
offset=0.1, frequency=10.0, phase=180.0),
sim.NoisyCurrentSource(mean=0.5, stdev=0.2, start=50.0,
stop=450.0, dt=1.0)]
for cell, current_source in zip(cells, current_sources):
cell.inject(current_source)
filename = normalized_filename("Results", "current_injection", "pkl", options.simulator)
sim.record('v', cells, filename, annotations={'script_name': __file__})
# === Run the simulation =====================================================
sim.run(500.0)
# === Save the results, optionally plot a figure =============================
vm = cells.get_data().segments[0].filter(name="v")[0]
sim.end()
if options.plot_figure:
from pyNN.utility.plotting import Figure, Panel
from quantities import mV
figure_filename = filename.replace("pkl", "png")
Figure(
Panel(vm, y_offset=-10 * mV, xticks=True, yticks=True,
xlabel="Time (ms)", ylabel="Membrane potential (mV)",
ylim=(-96, -59)),
title="Current injection example",
annotations="Simulated with %s" % options.simulator.upper()
).save(figure_filename)