"""
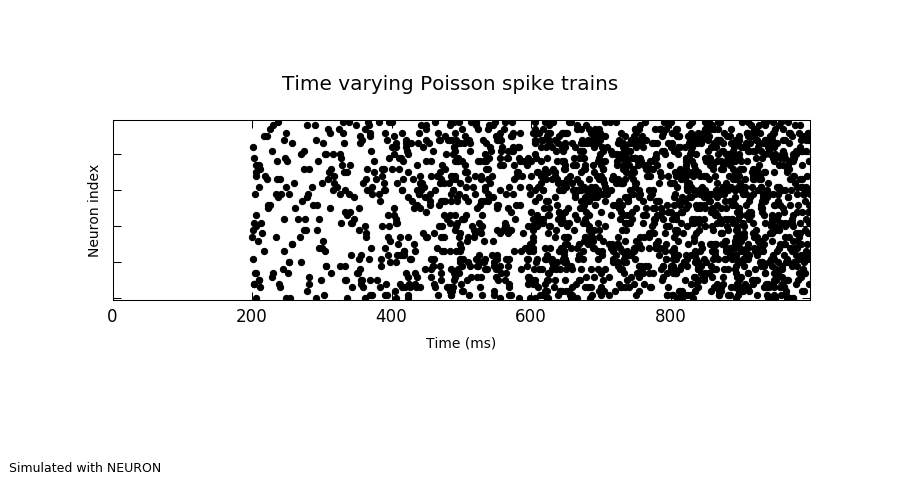
A demonstration of the use of callbacks to vary the rate of a SpikeSourcePoisson.
Every 200 ms, the Poisson firing rate is increased by 20 spikes/s
Usage: varying_poisson.py [-h] [--plot-figure] simulator
positional arguments:
simulator neuron, nest, brian or another backend simulator
optional arguments:
-h, --help show this help message and exit
--plot-figure Plot the simulation results to a file.
"""
import numpy as np
from pyNN.utility import get_simulator, normalized_filename, ProgressBar
from pyNN.utility.plotting import Figure, Panel
sim, options = get_simulator(("--plot-figure", "Plot the simulation results to a file.",
{"action": "store_true"}))
rate_increment = 20
interval = 200
class SetRate(object):
"""
A callback which changes the firing rate of a population of poisson
processes at a fixed interval.
"""
def __init__(self, population, rate_generator, interval=20.0):
assert isinstance(population.celltype, sim.SpikeSourcePoisson)
self.population = population
self.interval = interval
self.rate_generator = rate_generator
def __call__(self, t):
try:
self.population.set(rate=next(rate_generator))
except StopIteration:
pass
return t + self.interval
class MyProgressBar(object):
"""
A callback which draws a progress bar in the terminal.
"""
def __init__(self, interval, t_stop):
self.interval = interval
self.t_stop = t_stop
self.pb = ProgressBar(width=int(t_stop / interval), char=".")
def __call__(self, t):
self.pb(t / self.t_stop)
return t + self.interval
sim.setup()
# === Create a population of poisson processes ===============================
p = sim.Population(50, sim.SpikeSourcePoisson())
p.record('spikes')
# === Run the simulation, with two callback functions ========================
rate_generator = iter(range(0, 100, rate_increment))
sim.run(1000, callbacks=[MyProgressBar(10.0, 1000.0),
SetRate(p, rate_generator, interval)])
# === Retrieve recorded data, and count the spikes in each interval ==========
data = p.get_data().segments[0]
all_spikes = np.hstack([st.magnitude for st in data.spiketrains])
spike_counts = [((all_spikes >= x) & (all_spikes < x + interval)).sum()
for x in range(0, 1000, interval)]
expected_spike_counts = [p.size * rate * interval / 1000.0
for rate in range(0, 100, rate_increment)]
print("\nActual spike counts: {}".format(spike_counts))
print("Expected mean spike counts: {}".format(expected_spike_counts))
if options.plot_figure:
Figure(
Panel(data.spiketrains, xlabel="Time (ms)", xticks=True),
title="Time varying Poisson spike trains",
annotations="Simulated with %s" % options.simulator.upper()
).save(normalized_filename("Results", "varying_poisson", "png", options.simulator))
sim.end()