"""
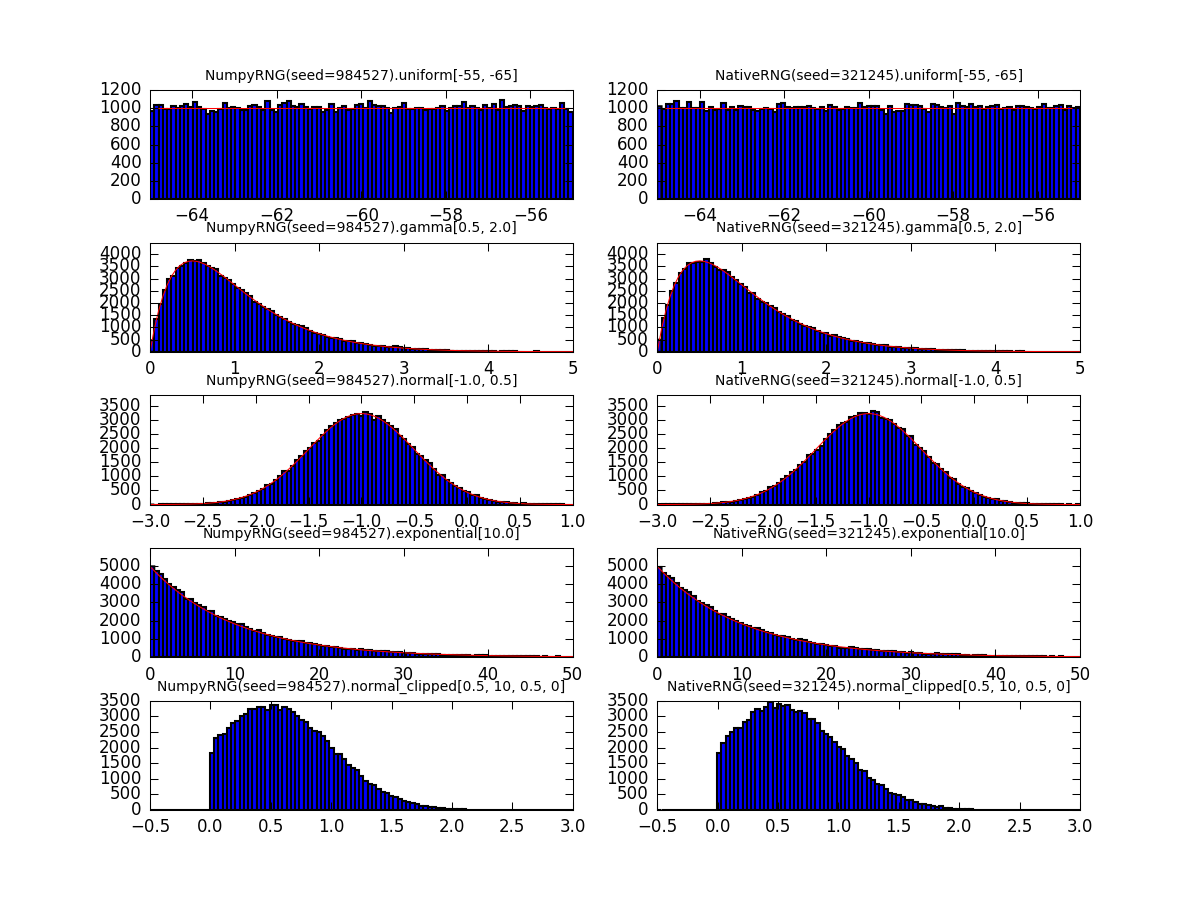
Illustration of the different standard random distributions and different random number generators
"""
import numpy
import matplotlib.pyplot as plt
import matplotlib.gridspec as gridspec
import scipy.stats
import pyNN.random as random
try:
from neuron import h
except ImportError:
have_nrn = False
else:
have_nrn = True
from pyNN.neuron.random import NativeRNG
n = 100000
nbins = 100
rnglist = [random.NumpyRNG(seed=984527)]
if random.have_gsl:
rnglist.append(random.GSLRNG(seed=668454))
if have_nrn:
rnglist.append(NativeRNG(seed=321245))
cases = (
("uniform", {"low": -65, "high": -55}, (-65, -55), scipy.stats.uniform(loc=-65, scale=10)),
("gamma", {"k": 2.0, "theta": 0.5}, (0, 5), scipy.stats.gamma(2.0, loc=0.0, scale=0.5)),
("normal", {"mu": -1.0, "sigma": 0.5}, (-3, 1), scipy.stats.norm(loc=-1, scale=0.5)),
("exponential", {'beta': 10.0}, (0, 50), scipy.stats.expon(loc=0, scale=10)),
("normal_clipped", {"mu": 0.5, "sigma": 0.5, "low": 0, "high": 10}, (-0.5, 3.0), None),
)
fig = plt.figure(1)
rows = len(cases)
cols = len(rnglist)
settings = {
'lines.linewidth': 0.5,
'axes.linewidth': 0.5,
'axes.labelsize': 'small',
'axes.titlesize': 'small',
'legend.fontsize': 'small',
'font.size': 8,
'savefig.dpi': 150,
}
plt.rcParams.update(settings)
width, height = (2 * cols, 2 * rows)
fig = plt.figure(1, figsize=(width, height))
gs = gridspec.GridSpec(rows, cols)
gs.update(hspace=0.4)
for i, case in enumerate(cases):
distribution, parameters, xlim, rv = case
bins = numpy.linspace(*xlim, num=nbins)
for j, rng in enumerate(rnglist):
rd = random.RandomDistribution(distribution, rng=rng, **parameters)
values = rd.next(n)
assert values.size == n
plt.subplot(gs[i, j])
counts, bins, _ = plt.hist(values, bins, range=xlim)
plt.title("%s.%s%s" % (rng, distribution, parameters.values()))
if rv is not None:
pdf = rv.pdf(bins)
scaled_pdf = n * pdf / pdf.sum()
plt.plot(bins, scaled_pdf, 'r-')
plt.ylim(0, 1.2 * scaled_pdf.max())
plt.xlim(xlim)
plt.savefig("Results/random_distributions.png")