"""
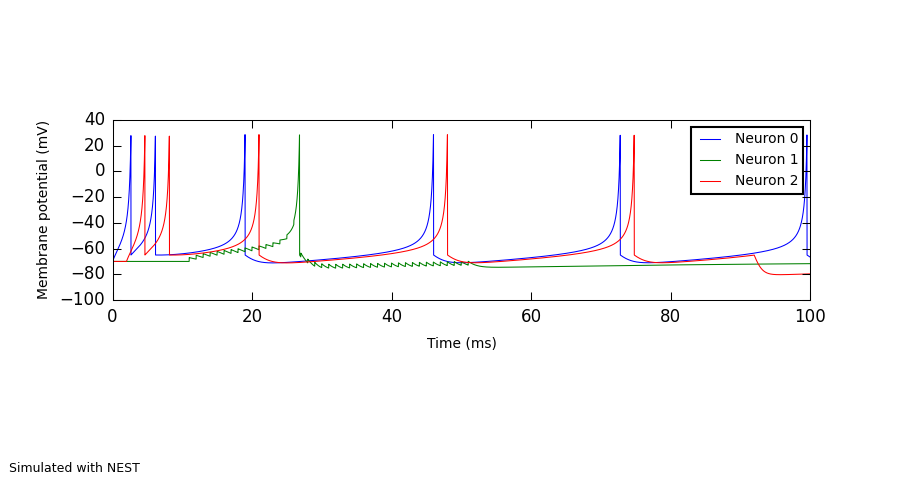
A selection of Izhikevich neurons.

Run as:

$ python Izhikevich.py <simulator>

where <simulator> is 'neuron', 'nest', etc.

"""

from numpy import arange
from pyNN.utility import get_simulator, init_logging, normalized_filename


# === Configure the simulator ================================================

sim, options = get_simulator(("--plot-figure", "Plot the simulation results to a file.", {"action": "store_true"}),
                             ("--debug", "Print debugging information"))

if options.debug:
    init_logging(None, debug=True)

sim.setup(timestep=0.01, min_delay=1.0)


# === Build and instrument the network =======================================

neurons = sim.Population(3, sim.Izhikevich(a=0.02, b=0.2, c=-65, d=6, i_offset=[0.014, 0.0, 0.0]))
spike_source = sim.Population(1, sim.SpikeSourceArray(spike_times=arange(10.0, 51, 1)))

connection = sim.Projection(spike_source, neurons[1:2], sim.OneToOneConnector(),
                            sim.StaticSynapse(weight=3.0, delay=1.0),
                            receptor_type='excitatory'),

electrode = sim.DCSource(start=2.0, stop=92.0, amplitude=0.014)
electrode.inject_into(neurons[2:3])

neurons.record(['v'])  # , 'u'])
neurons.initialize(v=-70.0, u=-14.0)


# === Run the simulation =====================================================

sim.run(100.0)


# === Save the results, optionally plot a figure =============================

filename = normalized_filename("Results", "Izhikevich", "pkl",
                               options.simulator, sim.num_processes())
neurons.write_data(filename, annotations={'script_name': __file__})

if options.plot_figure:
    from pyNN.utility.plotting import Figure, Panel
    figure_filename = filename.replace("pkl", "png")
    data = neurons.get_data().segments[0]
    v = data.filter(name="v")[0]
    #u = data.filter(name="u")[0]
    Figure(
        Panel(v, ylabel="Membrane potential (mV)", xticks=True,
              xlabel="Time (ms)", yticks=True),
        #Panel(u, ylabel="u variable (units?)"),
        annotations="Simulated with %s" % options.simulator.upper()
    ).save(figure_filename)
    print(figure_filename)


# === Clean up and quit ========================================================

sim.end()

