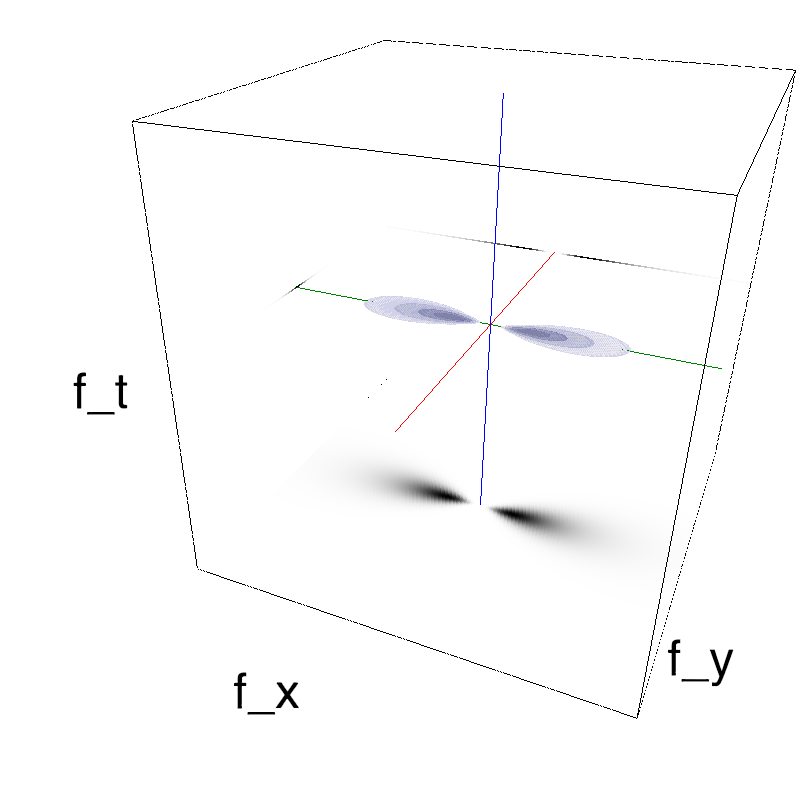
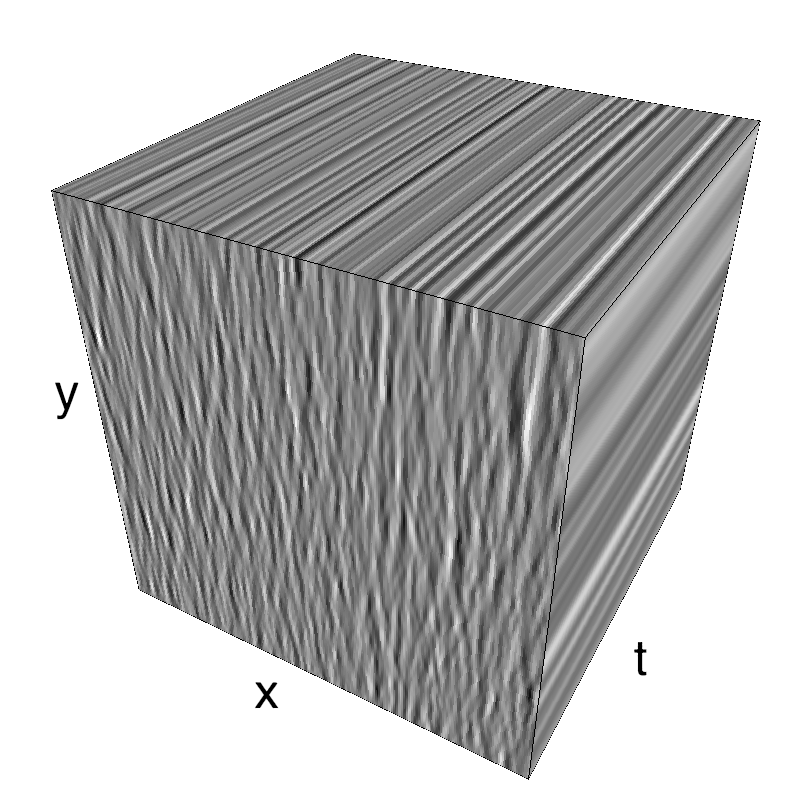
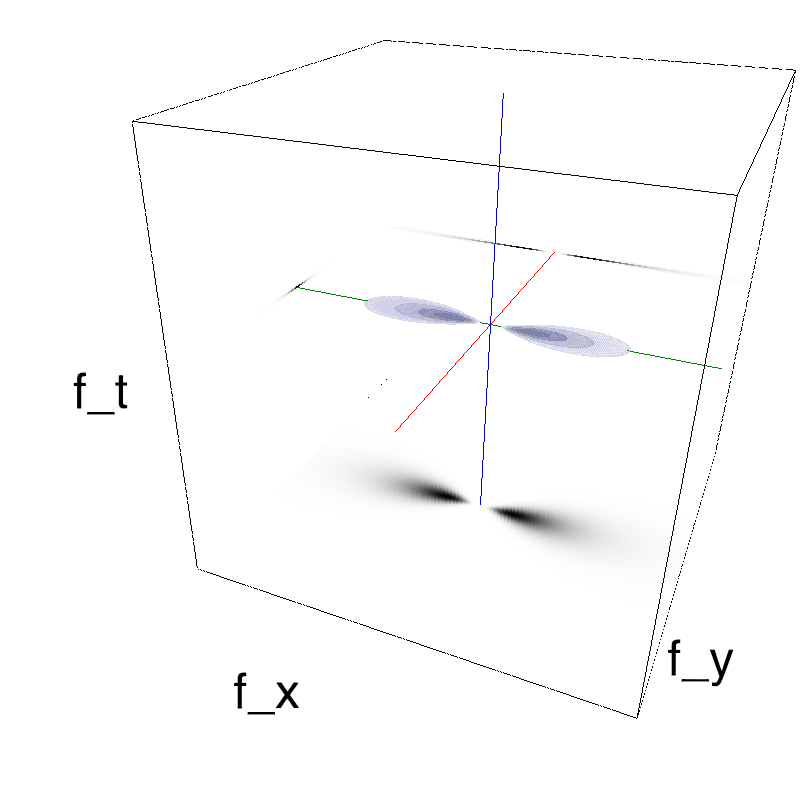
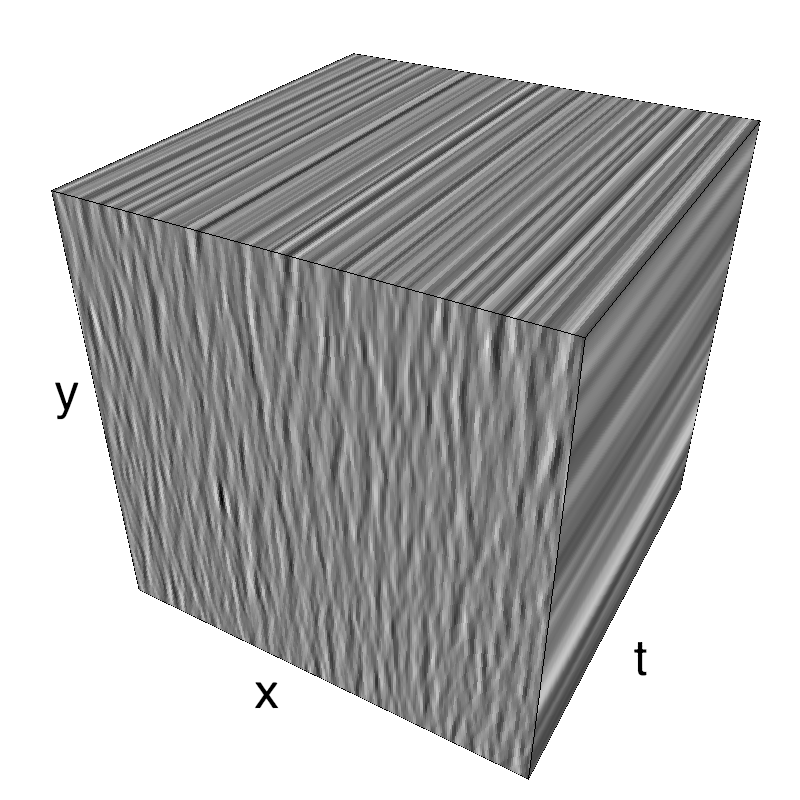
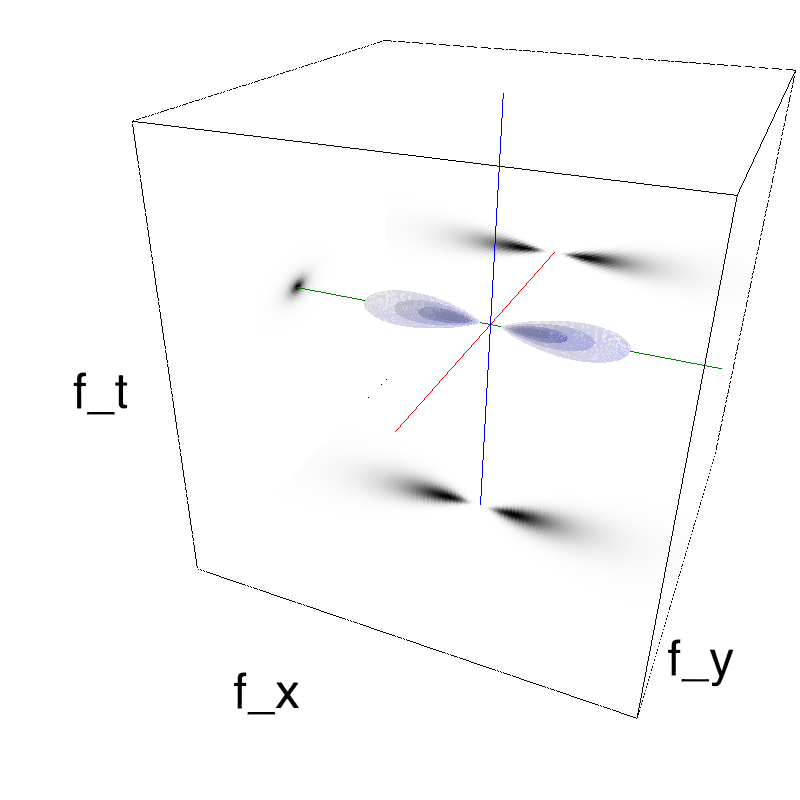
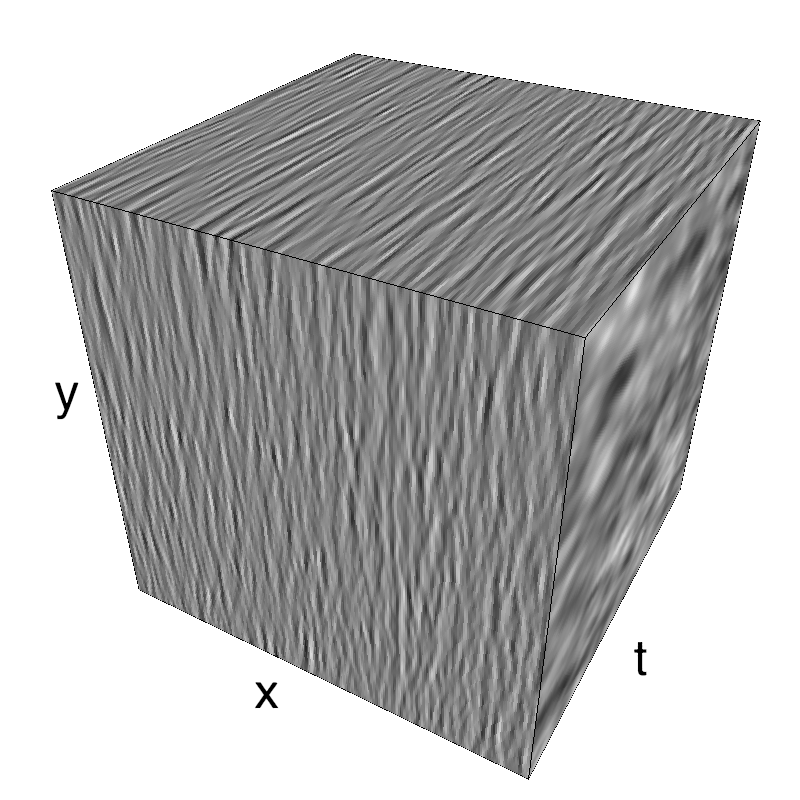
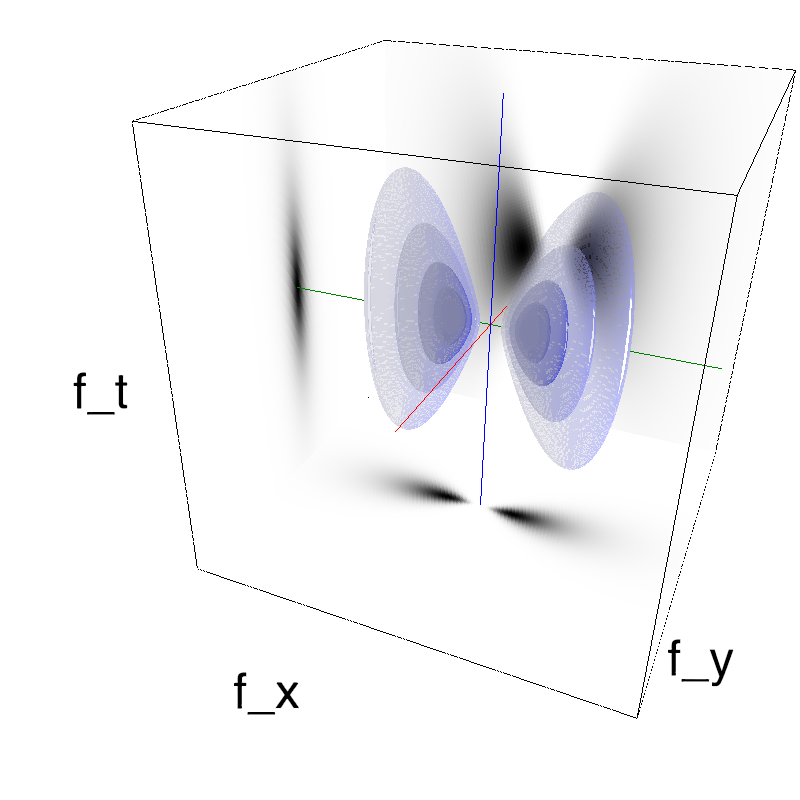
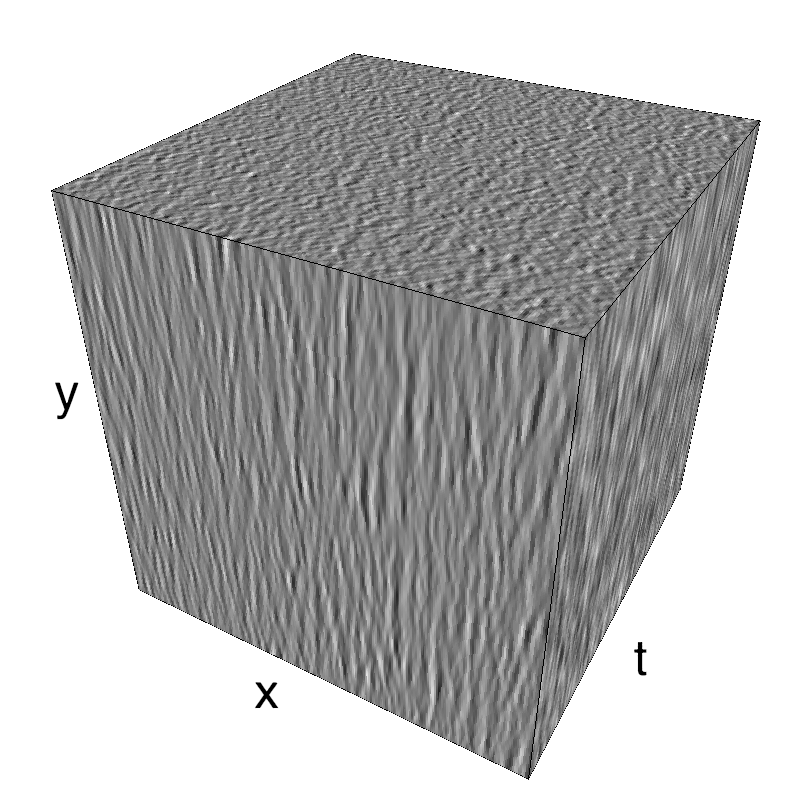
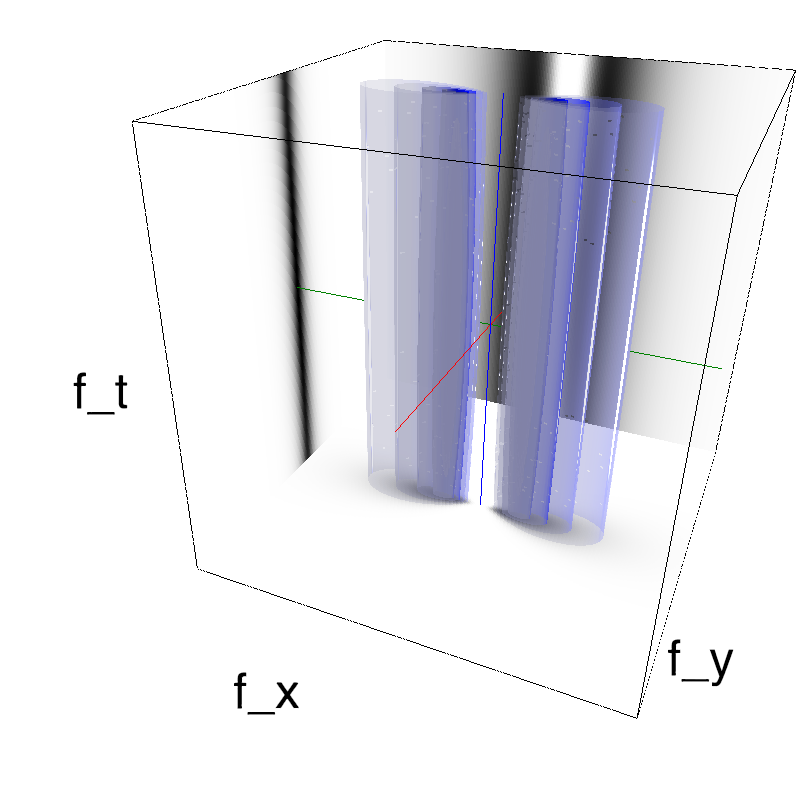
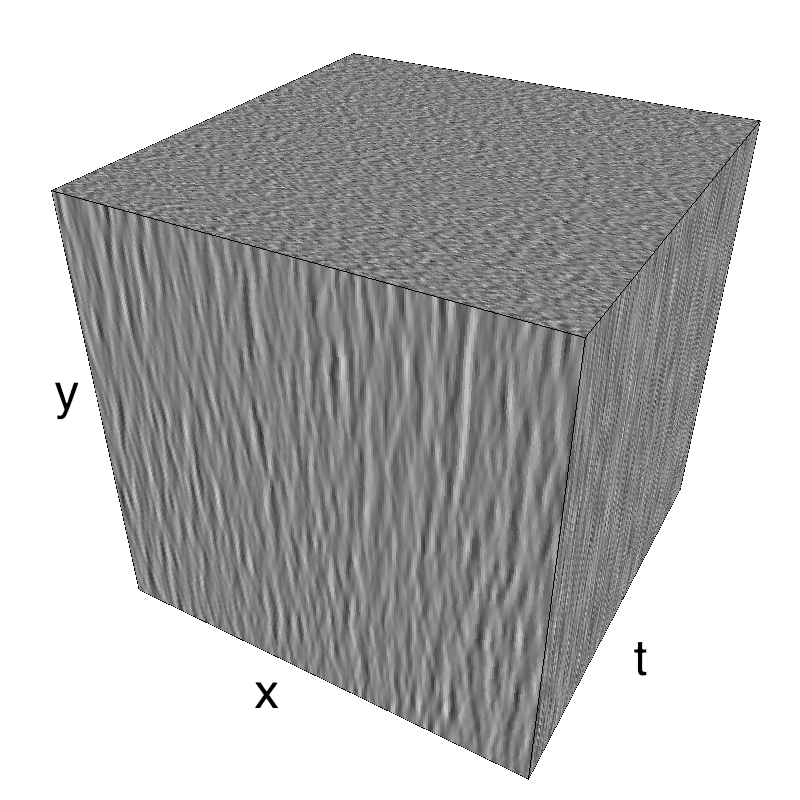
Speed distributions

In [1]:
%matplotlib inline
import numpy as np
np.set_printoptions(precision=3, suppress=True)
import pylab
import matplotlib.pyplot as plt
#!rm -fr ../files/speed*
In [2]:
import MotionClouds as mc
name = 'noisy-speed'
fx, fy, ft = mc.get_grids(mc.N_X, mc.N_Y, mc.N_frame)
print(mc.envelope_speed.__doc__)
    Returns the speed envelope:
    selects the plane corresponding to the speed ``(V_X, V_Y)`` with some bandwidth ``B_V``.

    * (V_X, V_Y) = (0,1) is downward and  (V_X, V_Y) = (1, 0) is rightward in the movie.
    * A speed of V_X=1 corresponds to an average displacement of 1/N_X per frame.
    To achieve one spatial period in one temporal period, you should scale by
    V_scale = N_X/float(N_frame)
    If N_X=N_Y=N_frame and V=1, then it is one spatial period in one temporal
    period. It can be seen along the diagonal in the fx-ft face of the MC cube.

    A special case is used when ``B_V=0``, where the ``fx-ft`` plane is used as
    the speed plane: in that case it is desirable to set ``(V_X, V_Y)`` to ``(0, 0)``
    to avoid aliasing problems.

    Run the 'test_speed' notebook to explore the speed parameters, see
    http://motionclouds.invibe.net/posts/testing-speed.html

    
In [3]:
# explore parameters
for B_V in [0.0, 0.01, 0.1, 1.0, 10.0]:
    name_ = name + '-B_V-' + str(B_V).replace('.', '_')
    z = mc.envelope_gabor(fx, fy, ft, V_X=0, B_V=B_V)
    mc.figures(z, name_)
    mc.in_show_video(name_)